There is no shortage of indicators in the development sector. Monitoring and evaluation manuals typically stress their importance; they’re referred to as “the backbone of M&E systems”, which “enable reliable monitoring and evaluation.” As a result, they are demanded by donors, supplied by programme staff and consultants, and misused by more or less everyone.
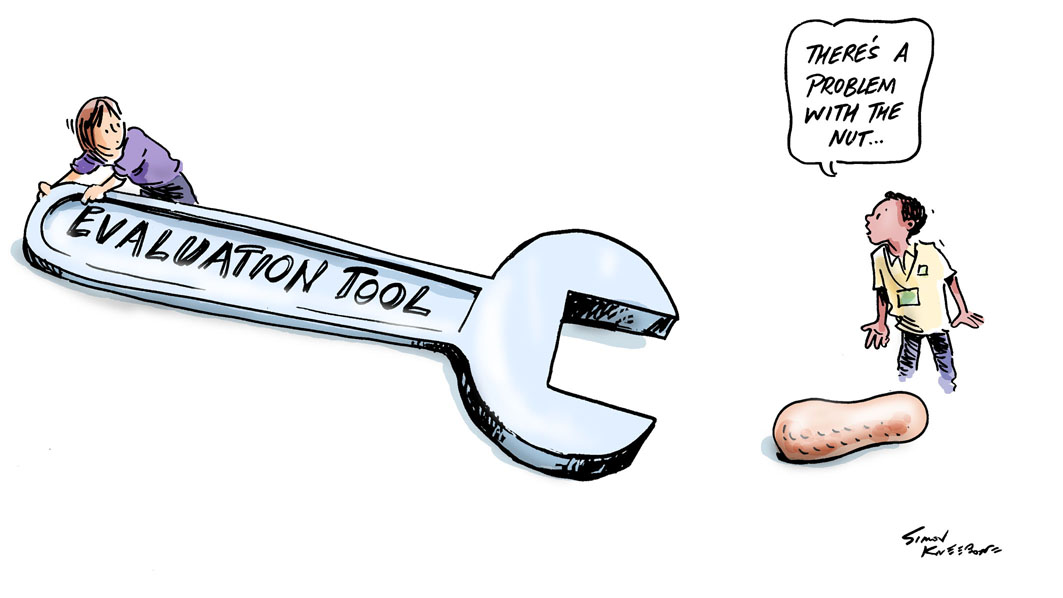
From Simon Kneebone http://simonkneebone.com/
An indicator is a simple idea; it’s a clearly defined, measurable metric. Progress against this metric will ‘indicate’ the performance of the programme. Typically indicators are defined in advance, and targets are set in order to see whether the programme is on track or not. Used correctly, indicators can indeed be a valuable tool. However, they need to be seen as one component of a good monitoring and evaluation system – rather than the ‘backbone’ of it. There are three reasons for this; indicators only capture a small portion of what you should measure, they are not good at capturing qualitative data, and they ignore unexpected information.
Firstly, pre-defined indicators are only a small portion of what you should monitor. Most M&E manuals suggest that you pick a few key indicators, but this risks blinding you to other important and available information. Even a short survey will gather information against tens or hundreds of potential indicators. For example, imagine that you run a survey to assess satisfaction with a health centre. A typical indicator might be ‘average satisfaction rates with the health centre.” However, this only captures a small part of the story. You should be interested in how satisfaction rates vary with gender, age, time or location. You might be interested in the distribution as well as the average; for example, are there some very dissatisfied clients? (And why?). Of course, indicators can be disaggregated, and more indicators developed to capture these additional factors. However, sets of indicators swiftly become too big to be useful, without capturing everything that you might want to examine. The key to good monitoring is flexible, imaginative use of data, not simply reporting against pre-defined indicators.
Secondly, indicators are not good at capturing qualitative data. This is not for want of trying; the OECD evaluation glossary, for example, suggests that indicators should be both qualitative and quantitative. Qualitative indicators may well be very useful in theory – but in five years working in monitoring and evaluation I’ve never seen one that made sense. Qualitative indicators tend to fall in one of two categories. The first is to present quantified opinions, such as ‘’90% of participants believe that the training course was great.” This can be very useful, but is not actually qualitative data. Alternatively, qualitative indicators can become so vague as to be useless, such as ‘participants were satisfied with the training course.’ Good qualitative data is, however, essential for understanding progress, sustainability, and success of a project. Since an indicator presents a single variable along which views can vary, it does not provide the open framework needed to collect good qualitative information.
Finally, indicators – by their nature – can only capture what you’ve predicted in advance. They consequently can miss unexpected changes or challenges. To continue the healthcare example, a good monitoring system should pick up if local beliefs conflict with the health services provided. It should help to build understanding of how global events – such as the recent outbreak of ebola – impact on your work. All of these could be essential to monitor, but very difficult to predict and set indicators for in advance.
Of course indicators are important. They can be a great communication tool, allowing a clear message to be communicated externally. For example, DFID sets consistent indicators across the organisation; this allows it to boast that, last year, they provided access to financial services for 54,450 people. (And, more mysteriously, that 85,806,000 people have choice and control over their own development.) Indicators can set strategic direction – as the MDGs have successfully concentrated international attention on service delivery in developing countries. Indicators are crucial for giving an overall understanding of a complex portfolio, helping managers to compare progress across different contexts using commonly defined indicators. Finally, defining indicators forces staff to think about the data they need to collect, and what success would look like.
Consequently, indicators should be seen as one component of a strong M&E system – rather than the core of it. Unfortunately, this isn’t always the case. I have conducted a number of consultancies to help organisations develop their M&E system, and after much confusion discovered that what the client really wanted was a set of indicators. The international development community as a whole places great stress on indicators, captured in logframes, results management systems, and endless guidance notes. But if you really want to create strong M&E systems which allow you to understand success of the programme, reasons for this success, and emergent trends, indicators aren’t the place to start.
See the next blog in the series: Why Don’t We Ever Learn?

“Good qualitative data is, however, essential for understanding progress, sustainability, and success of a project. Since an indicator presents a single variable along which views can vary, it does not provide the open framework needed to collect good qualitative information.”
Amen. This presents one of the biggest challenges (and oversights) in the open/big data agenda; what are we doing about including/capturing/acknowledging and problematising qual. data and research methodology that is grounded in that which cannot be made into an indicator?
Very good question! Would be very interested if any readers have good examples of that.
Thanks for the article – there’s a couple of things that jump out at me here:
“Qualitative indicators tend to fall in one of two categories. The first is to present quantified opinions, such as ‘’90% of participants believe that the training course was great.” This can be very useful, but is not actually qualitative data.”
Possibly what you mean here is the indicator isn’t qualitative, but it’s entirely possible the data behind it was, if the participants were asked “why”. Behind the “90% great” response might be a range of possible answers. As you rightly say, you can quantify opinions, thus proving you can use qualitatively gathered data to populate a numerical indicator.
“Since an indicator presents a single variable along which views can vary, it does not provide the open framework needed to collect good qualitative information.”
In order to generate a truly open framework of qualitative indicators (you and Brendan hint at this) one technique is to flip the process on its head and start with no assumptions at all. This research method is known in academia as Grounded Theory and produces qualitative indicators from the data, rather than using pre-determined indicators to gather data against. It’s used all the time in satisfaction or user experience surveys where participants give longer feedback, beyond binary and pre-selected answers. I use it in my work because there was no pre-existing data on my research question and I really wanted to understand the processes at work in a particular policy area. Using your health centre as an example, qualitative indicators that might emerge against questions about usage might be “Location” with possible sub-categories underneath that “transport connections” “safety”. Once a pattern emerges, qualitative indicators can be turned into quantitative indicators, the difference is not making assumptions about what to measure in the first place. The trouble is this process is time and labour intensive. It also requires a fair amount of bravery and trust to take this approach in donor funded projects and is probably why it is favoured over quicker quantitative monitoring.
Thanks Sarah, some great points there.
I think the first point is right to point out that a quantitative indicator could be derived from strong qualitative data. This points the way to how indicators can be used more constructively, which perhaps needs to be a follow up blog! Participatory statistics (see ids paper) have a similar aim.
I think the grounded theory type approach also requires a high level of skill and confidence from the implementing staff, which is another barrier to its adoption. The ‘trust’ is important on the assumption that quantitative data is harder to creatively massage – which is sometimes true, but quite clearly not always!
I agree, all statistics can be creatively massaged! Confirmation bias is another issue (seeing what you want to see and ignoring other emerging themes) and something I am having to watch out for all the time. You’re right about confidence too, though with digital technology, it’s possible for the data gathering and analysis to be done entirely separately and remotely.
Pingback: Saturday Morning Reading #29 | A Pett Project
Pingback: Why Don’t We Ever Learn? | AID LEAP
Pingback: On Horseshit | AID LEAP